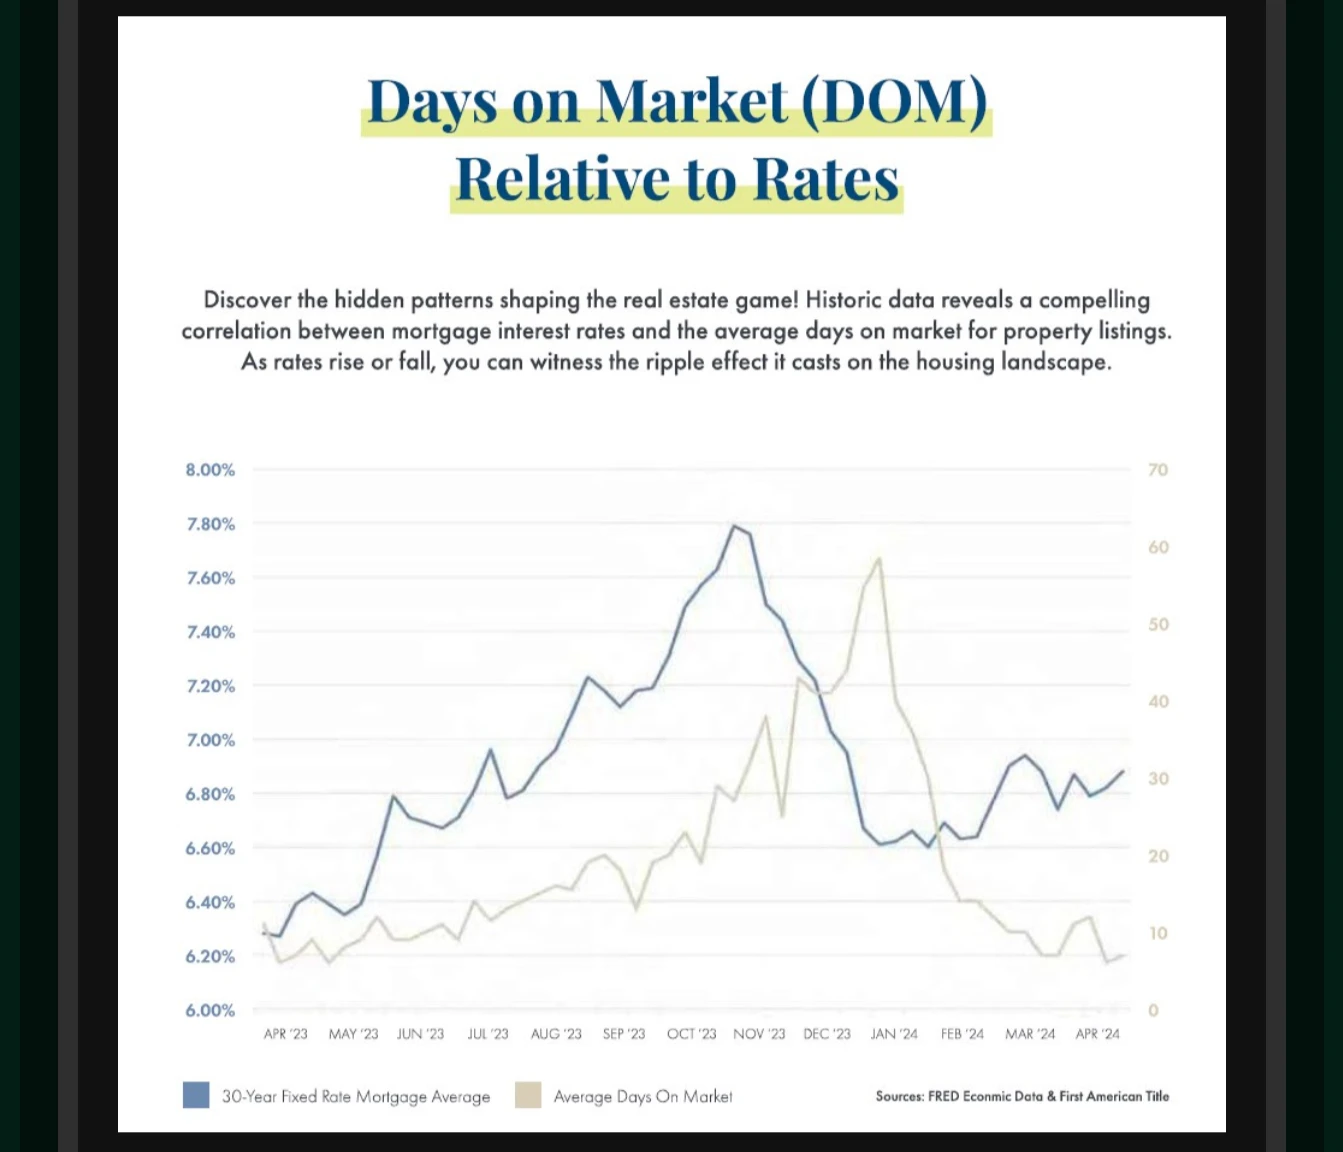
An agent sent me this chart at the same time I was discussing this exact topic with a current selling client — the timing was almost too on-the-nose. The market right now looks a lot like the fall of 2023. Can we expect history to repeat itself?
Why the Lag Matters More Than the Correlation
It's tempting to look at that chart and say "rates up, market slow — got it." But the useful part is the timing. When affordability takes a hit, homes don't start sitting the next week. The buyers already in motion close their deals; it's the next wave that hesitates. So days-on-market is a trailing indicator — it tells you what rates did a month or two ago, not what they're doing today.
That lag is exactly why winter fools people. By the time "the market is slow" is obvious in the data, rates may already be easing — which is the setup for the spring snap-back the chart shows so clearly.
Late 2026 Is Rhyming With Late 2023
Here's why that old chart feels so relevant right now. Line up the two autumns and the parallels are hard to miss:
A fall rate run-up. In 2023, the 30-year pushed to about 7.8%. This fall, rates ran back up into the high 7s before easing — the same chord, close to the same notes.
A late-year easing. In late 2023 it was the bond market sensing the Fed was finished hiking. This fall it's a flight to safety out of a wobbly, AI-heavy stock market that's pulled the 10-year Treasury back under 5%. Different reason, same direction.
Inventory and days-on-market creeping up into winter. We came into November with the deepest selection of the year — just under five months of supply metro-wide — and homes taking a touch longer to sell, right on the seasonal schedule. If you read the last two updates, this will sound familiar: more homes, fewer competing buyers, sellers getting flexible on terms. That's the top-left of the 2023 chart playing out again.
If History Repeats…
Say the pattern holds. What did it do next in 2024? Days-on-market kept climbing into the dead of winter — which, counterintuitively, is exactly when buyer leverage peaked. The homes still on the market in December and January belonged to the most motivated sellers, and there were the fewest other buyers in the room to bid against. Then spring arrived, rates had settled, and that leverage evaporated almost overnight as days-on-market snapped back down and competition returned.
Translated into a move: the best negotiating position in that cycle wasn't the spring everyone waits for — it was the quiet, cold, "nobody's buying" stretch right before it. By the time the numbers confirmed the turn, the window was already closing.
The bottom in buyer leverage tends to show up in the coldest, quietest weeks — not when the spring headlines announce the market is "back." If the 2023–24 pattern repeats, the play is to be ready to act in December and January, not to wait for March to confirm it. Get fully pre-approved now, know your number, and line up a lender who can move quickly. I'll help you watch for the moment a rate dip and the right house show up at the same time.
But Don't Bet the House on a Chart
Two lines that rhymed once are a reason to pay attention, not a crystal ball. A few honest caveats:
Correlation isn't a promise. The chart shows days-on-market moving with rates and the seasons — it does not show prices falling. Through all of 2023–24, Denver prices barely budged, and they've been essentially flat here for three years running. A slower market is a negotiating opportunity, not a fire sale.
2026 isn't 2023. We're carrying more inventory than back then, the lock-in effect is still keeping would-be sellers in their 3% mortgages, and the Fed's path from here is its own open question. More supply could mean the leverage lasts longer than a single winter — or that the spring snap-back is softer than last time.
Rates can refuse to cooperate. The easing that pulled yields down this fall leaned on a jittery stock market. If stocks calm down, some of what pushed rates lower could reverse just as quickly.
None of that breaks the pattern. It just means you treat the chart as a guide to behavior and timing, not a guarantee about prices.
What It Means For You
If you're buying: This is the stretch of the cycle the chart says to care about. Selection is the best it's been all year and competition thins out as it gets cold — so if you can transact in the winter lull, you may catch the most leverage of the whole year. Get pre-approved now, so a rate dip and the right house don't slip past while you're still getting organized.
If you're selling: The same chart is both a warning and an opportunity. Days-on-market climbs in winter, so price to today's market and don't bank on a bidding war. But if the pattern holds and rates ease into spring, listing into a faster, hungrier market has real appeal. Whether you go now or wait for the snap-back depends on your home, your price band, and your timeline — worth a real conversation.
As always, this isn't a reason to rush or to wait. It's a reason to put the pattern next to your own numbers and your own timeline. That's exactly the conversation I'm here for — no obligation.
This article is general market commentary for informational purposes only and is not financial, investment, or lending advice. Mortgage rates and market figures change frequently and vary by borrower and property; consult a licensed lender for rate quotes specific to you. Past market patterns do not guarantee future results. Search Colorado RE LLC — Equal Housing Opportunity.
Thinking About a Move This Winter?
Tell me your timeline and your must-haves. I'll send you a straight read on what your specific move looks like in today's market — no pressure, no obligation.